
The Decline Of The US Dollar's Purchasing Power Since The Year 1913
In 1913, a single dollar could buy you 30 Hershey's chocolate bars.
Today, that same dollar barely covers a pack of gummies.
This isn't just an interesting historical footnote. It's a stark illustration of the most significant threat to your retirement savings: the systematic erosion of the dollar's purchasing power.
The 97% Decline Nobody Talks About
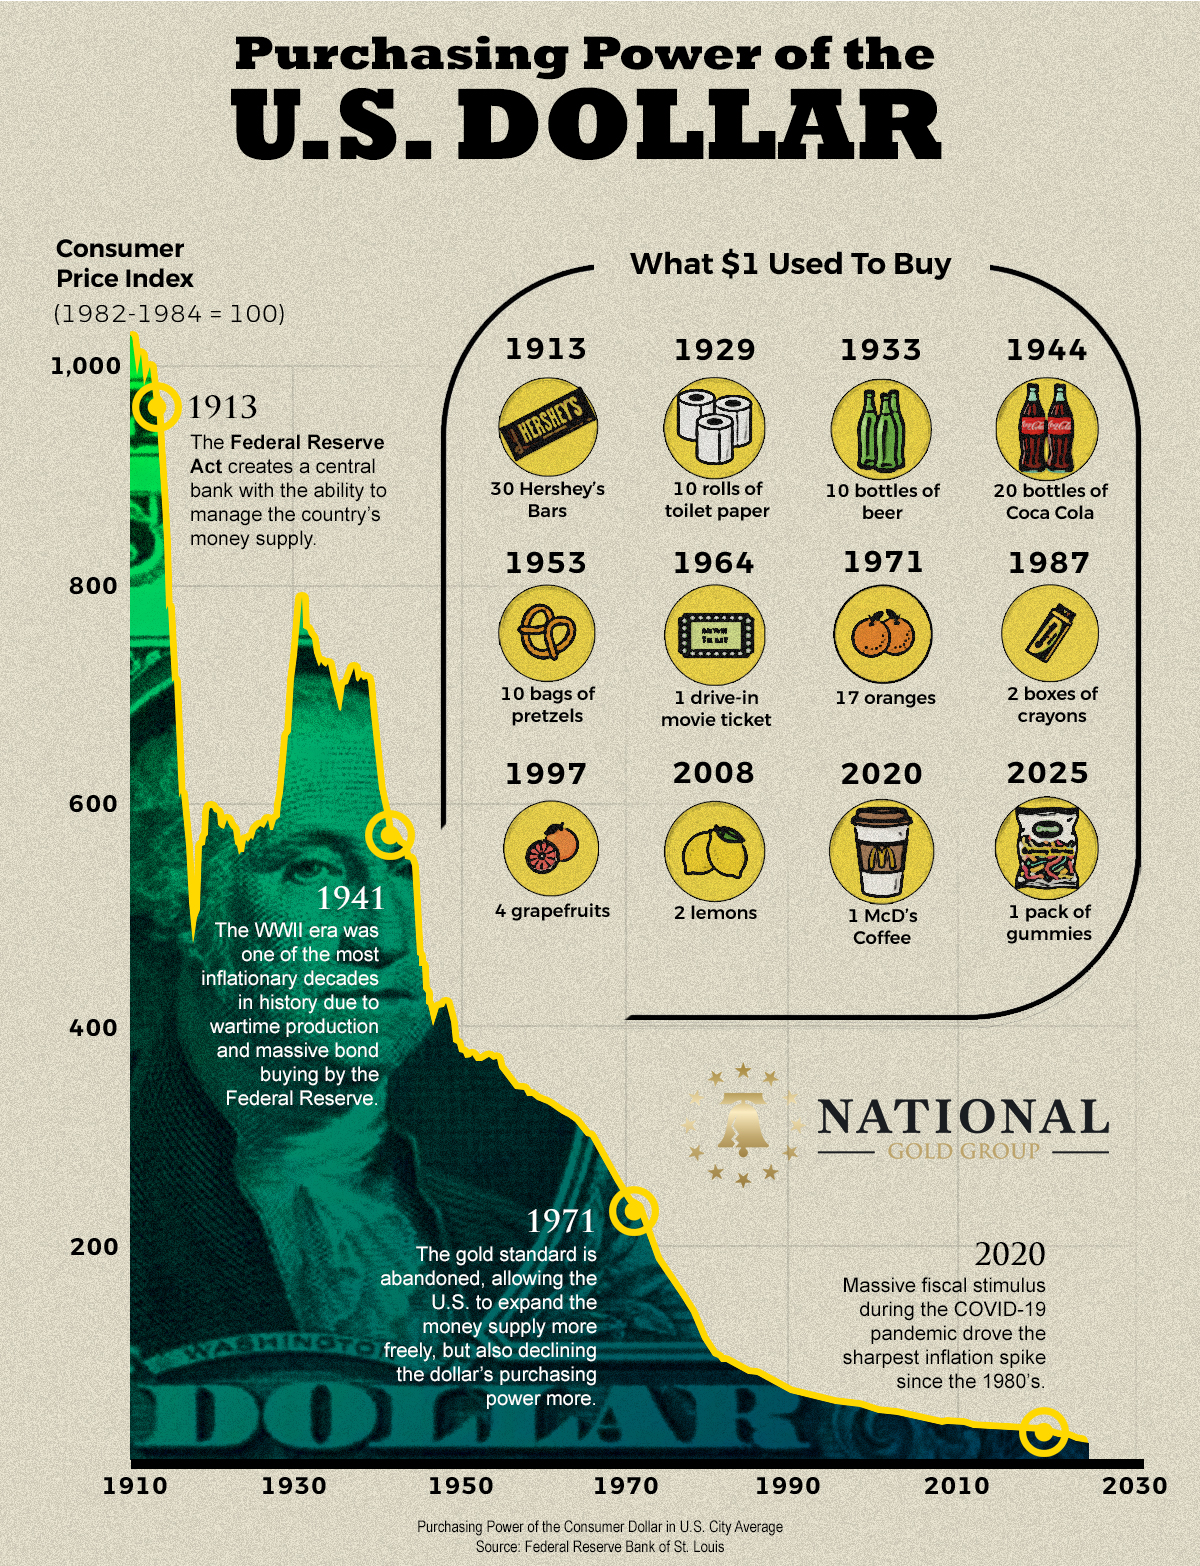
According to data from the Federal Reserve Bank of St. Louis, the U.S. dollar has lost approximately 97% of its purchasing power since 1913.
Using the Consumer Price Index (1982-1984 = 100) as a baseline, we can track this decline through everyday items that tell the story of monetary debasement more clearly than any economic theory.
What One Dollar Could Buy Through the Decades
1913: 30 Hershey's Bars
The year the Federal Reserve Act created a central bank with the ability to manage and expand the country's money supply.
1929: 10 rolls of toilet paper
Just before the Great Depression, a dollar still had substantial purchasing power for household essentials.
1933: 10 bottles of beer
Even during the depths of the Depression, a dollar went remarkably far.
1944: 20 bottles of Coca-Cola
Despite wartime inflation, the dollar maintained relatively strong purchasing power.
1953: 10 bags of pretzels
Post-war prosperity, but the dollar was beginning its long decline.
1964: 1 drive-in movie ticket
The last year of silver quarters, which was the end of an era for sound money.
1971: 17 oranges
The year the gold standard was abandoned, marking a turning point in monetary history.
1987: 2 boxes of crayons
The purchasing power decline was accelerating.
1997: 4 grapefruits
By the late 1990s, a dollar bought very little.
2008: 2 lemons
The Great Financial Crisis exposed the fragility of the banking system. The Federal Reserve's response was unprecedented quantitative easing and bailouts that injected trillions into the economy, setting the stage for the next wave of dollar debasement. What started as an emergency measure became permanent policy.
2020: 1 McDonald's coffee
After massive fiscal stimulus during COVID-19, the dollar hit new lows.
2025: 1 pack of gummies
Today's reality is that a dollar buys almost nothing.
Three Pivotal Moments That Destroyed the Dollar
The infographic highlights three critical turning points in the dollar's decline, each corresponding to major policy decisions that expanded the money supply and eroded purchasing power.
1913: The Federal Reserve Act
The creation of the Federal Reserve gave the government unprecedented ability to expand the money supply.
While sold to the public as a way to stabilize the economy and prevent bank runs, it effectively removed the natural constraints on money creation that existed under the gold standard.
The Consumer Price Index chart shows the dollar's purchasing power at its peak in 1913, indexed at nearly 1,000. From that point forward, it was all downhill.
1941: World War II and Massive Bond Buying
The WWII era was one of the most inflationary decades in American history. To finance the war effort, the Federal Reserve engaged in massive bond buying, flooding the economy with newly created money.
The chart shows a dramatic spike in the CPI during this period, reaching nearly 800, which is a clear signal that wartime monetary expansion was destroying the dollar's value even as Americans were being told to buy war bonds to support the troops.
1971: The Gold Standard Abandoned
This was the death blow to sound money. When President Nixon closed the gold window and ended the Bretton Woods system, he removed the last constraint on money creation. The dollar became a pure fiat currency, backed by nothing but government promises.
The chart shows the purchasing power dropping from around 200 in 1971 to below 100 by the 1980s. The dollar could now be expanded freely, and politicians took full advantage, spending without restraint and paying for it through monetary debasement.
2020: COVID Stimulus and the Sharpest Inflation Spike Since the 1980s
The massive fiscal stimulus during the COVID-19 pandemic drove the sharpest inflation spike since the 1980s. Trillions of dollars were created out of thin air and injected into the economy through stimulus checks, PPP loans, and expanded unemployment benefits.
The result? The purchasing power of the dollar plummeted to historic lows, now hovering near zero on the chart.
And it's important to remember, that inflation is cumulative. So that massive inflation spike is baked into the economy forever.
The Pattern Is Clear:
More Money Printing = Less Purchasing Power
The infographic tells a simple but devastating story.
Every time the government expands the money supply—whether for war, economic stimulus, or political expediency—the purchasing power of every dollar you hold declines.
This isn't a conspiracy theory. It's basic economics, confirmed by over a century of Federal Reserve data.
The Acceleration Is Getting Worse
Notice the shape of the curve. The decline in purchasing power was relatively gradual from 1913 to 1971. But after the gold standard was abandoned, the decline accelerated dramatically.
And after 2020? The drop is nearly vertical.
We're witnessing the endgame of a fiat currency system that has been pushed beyond its limits.
The government's debt is now over $38 trillion and growing. Interest payments exceed $1 trillion annually. The only way to service this debt is to print more money, which further erodes the dollar's value.
It's a death spiral, and your retirement savings are caught in the middle.
What This Means for Your Retirement
If you're holding your retirement savings in dollar-denominated assets—cash, bonds, money market funds—you're watching your purchasing power evaporate in real time.
Even if your account balance stays the same or grows modestly, the actual value of that money is declining.
The 401(k) Illusion
Most Americans have been taught to trust their 401(k) or IRA, to dollar-cost average into index funds, and to believe that time in the market will solve everything.
But this advice assumes a stable currency. It assumes that the dollars you're accumulating will maintain their purchasing power over the 20, 30, or 40 years until you retire.
The infographic proves that assumption is dangerously wrong.
The Assets That Preserve Purchasing Power
While the dollar has lost 97% of its value since 1913, certain assets have not only maintained their purchasing power, they've increased it.
Gold: The Constant
In 1913, an ounce of gold cost about $20. Today, it's over $4,000.
But here's the key insight: gold didn't become more valuable. The dollar became less valuable.
Gold simply maintained its purchasing power while the dollar collapsed.
That's why central banks around the world are buying gold at record levels. They understand that fiat currencies are in terminal decline, and they're protecting their reserves with the one asset that has preserved wealth for over 5,000 years.
Real Assets vs. Paper Promises
The lesson from this infographic is clear: paper assets denominated in a depreciating currency are not a store of value. They're a slow-motion confiscation of your wealth.
Real assets—gold, silver, real estate, productive land, commodities—maintain their value because they can't be printed into existence by a central bank.
The Next Chapter: Where Do We Go From Here?
The purchasing power chart shows the dollar's purchasing power approaching zero.
What happens when the dollar loses the last remnants of its value?
History provides the answer: monetary reset. A return to some form of hard money backing, whether through gold, commodities, or a basket of assets.
The question isn't whether this will happen.
The question is whether you'll be prepared when it does.
Protecting Your Purchasing Power
The infographic is a warning. It's showing you, in the clearest possible terms, that holding dollars is a losing strategy.
Every year you wait, every year you keep your retirement savings in cash or bonds or dollar-denominated assets, you're losing purchasing power.
The solution isn't complicated:
- Diversify out of pure dollar exposure into assets that maintain purchasing power.
- Allocate to gold and precious metals as insurance against currency debasement.
- Understand that "safe" assets like bonds are only safe in nominal terms, not real terms.
- Recognize that the traditional 60/40 portfolio was designed for a different monetary era (which is why now, for the first time in history, even Morgan Stanley advises 20% allocation to gold).
The Bottom Line
That's the story of the U.S. dollar over the past 112 years.
It's not a story of economic progress. It's a story of systematic wealth confiscation through monetary debasement.
The chart doesn't lie. The trend is clear. And the endpoint is inevitable.
The only question is: what are you going to do about it?

%20(6)-2.png)
%20(11)-1.png)
%20(17).png)